宁泽林_NiZerin - 互联网技术博客

  • PHP
  • Go
  • Java
  • Rust
  • Python
  • 交流群
  • 关于我
  • 留言版
  1. 首页
  2. Vue.js
  3. 正文

vue文件如何使用echarts.js?(两种方法介绍)

2018年10月19日 3904点热度 0人点赞 0条评论

本篇文章给大家带来的内容是关于vue文件如何使用echarts.js?(两种方法介绍),有一定的参考价值,有需要的朋友可以参考一下,希望对你有所帮助。
最近工作中需要用到echarts,由于项目是用的vue-cli开发的。在网上搜到vue中合成了vue-echarts,但是不想使用vue中规定好的数据格式,于是就自己做了一个vue项目引用原生echarts的简单demo,实现过程如下:用了两种实现方式
准备工作
1、安装echarts依赖
控制台输入:npm install echarts --save
2、全局引入
main.js中引入

1

2

import echarts from 'echarts'

Vue.prototype.$echarts = echarts

创建图表
第一种创建方式
在一个.vue文件中引入多张图表

  • 创建WelcomePage.vue

1

2

3

4

5

6

7

8

9

10

11

12

13

14

<template>

  <div>

    <h1>第一种在vue中使用echart的方式</h1>

    <div class="charts">

      <div id="barGraph" style="height: 350px;"></div>

    </div>

    <div class="charts">

      <div id="pieGraph" style="height: 350px;"></div>

    </div>

  </div>

</template>

1

2

3

4

5

6

7

8

9

10

11

12

13

14

15

16

17

18

19

20

21

22

23

24

25

26

27

28

29

30

31

32

33

34

35

36

37

38

39

40

41

42

43

44

45

46

47

48

49

50

51

52

53

54

55

56

57

58

59

60

61

62

63

64

65

66

67

68

69

70

71

72

73

74

75

76

77

78

79

80

81

82

83

84

85

86

87

88

89

90

91

92

93

94

95

96

97

98

99

100

101

102

103

104

105

106

107

108

109

110

111

112

113

114

115

<script>

// 引入基本模板,按需加载

  let echarts = require('echarts/lib/echarts');

  // 引入柱状图

  require('echarts/lib/chart/bar');

  // 引入柱状图

  require('echarts/lib/chart/pie');

  require('echarts/lib/component/tooltip');

  require('echarts/lib/component/title');

export default {

  name: "WelcomePage",

  data () {

    return {  }

  },

  mounted(){

    this.drawBar();

    this.drawPie();

  },

  methods:{

    drawBar(){

      // 基于dom,初始化echarts实例

      let barGraph = echarts.init(document.getElementById('barGraph'));

      // 绘制图表

      barGraph.setOption({

        title: {

          text: '全年产量趋势图',

          left: 'center'

        },

        tooltip: {

          trigger: 'item',

          formatter: '{a} <br/>{b} : {c}'

        },

        legend: {

          left: 'center',

          data: ['本年', '上年'],

          bottom:0

        },

        xAxis: {

          type: 'category',

          name: 'x',

          splitLine: {show: false},

          data: ['一月', '二月', '三月', '四月', '五月', '六月', '七月', '八月', '九月', '十月', '十一月', '十二月']

        },

        grid: {

          left: '1%',

          right: '2%',

          bottom: '8%',

          containLabel: true

        },

        yAxis: {

          type: 'category',

          name: 'y',

          splitLine: {show: true},

          data:['10%','20%','30%','40%','50%','60%','70%','80%','90%','100%']

        },

        series: [

          {

            name: '本年',

            type: 'line',

            data: [0.8, 0.98, 0.96, 0.27, 0.81, 0.47, 0.74, 0.23, .69, 0.25, 0.36, 0.56]

          },

          {

            name: '上年',

            type: 'line',

            data: [1, 0.2, 0.4, 0.8, 0.16, 0.32, 0.64, 1.28, 5.6, 0.25, 0.63, 0.65, 0.12]

          },

        ]

      })

    },

    drawPie(){

      let pieGraph = echarts.init(document.getElementById('pieGraph'));

      pieGraph.setOption({

        title : {

          text: '某站点用户访问来源',

          subtext: '纯属虚构',

          x:'center'

        },

        tooltip : {

          trigger: 'item',

          formatter: "{a} <br/>{b} : {c} ({d}%)"

        },

        legend: {

          orient: 'vertical',

          left: 'left',

          data: ['直接访问','邮件营销','联盟广告','视频广告','搜索引擎']

        },

        series : [

          {

            name: '访问来源',

            type: 'pie',

            radius : '55%',

            center: ['50%', '60%'],

            data:[

              {value:335, name:'直接访问'},

              {value:310, name:'邮件营销'},

              {value:234, name:'联盟广告'},

              {value:135, name:'视频广告'},

              {value:1548, name:'搜索引擎'}

            ],

            itemStyle: {

              emphasis: {

                shadowBlur: 10,

                shadowOffsetX: 0,

                shadowColor: 'rgba(0, 0, 0, 0.5)'

              }

            }

          }

        ]

      })

    }

  }

}

</script>

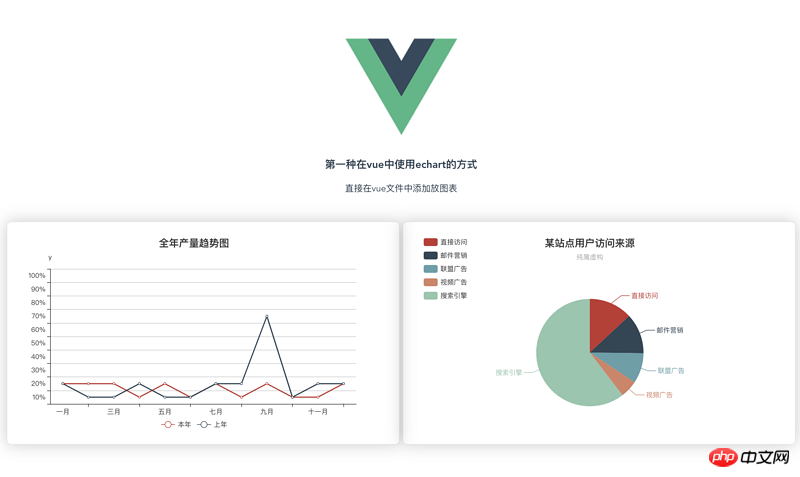
实现效果如下图:
3372858769-5bc7e30eddaec_articlex.png
第二种实现方式(以组件的形式)
创建父组件 father.vue

1

2

3

4

5

6

7

8

9

10

11

12

<div>

  <h1>{{ msg }}</h1>

  <p>第二种方式:通过组件的方式进行页面渲染</p>

  <div class="container" >

    <bar-graph></bar-graph>

  </div>

  <div class="container">

    <pie-graph></pie-graph>

  </div>

</div>

1

2

3

4

5

6

7

8

9

10

11

12

13

14

15

16

17

<script>

// 引入两个子组件

  import BarGraph from "./bargraph";

  import PieGraph from "./piegraph";

  export default {

    name: "father",

    components:{

      BarGraph,

      PieGraph,

    },

    data(){

      return{

        msg: '我是爸爸,想看我的儿子,眼睛请往下移',

      }

    }

  }

</script>

  • 创建子组件barGraph.vue

1

2

3

4

5

6

<div>

  <p>{{ msg }}</p>

  <div class="charts">

    <div :id="id" style="min-height: 350px;"></div>

  </div>

</div>

1

2

3

4

5

6

7

8

9

10

11

12

13

14

15

16

17

18

19

20

21

22

23

24

25

26

27

28

29

30

31

32

33

34

35

36

37

38

39

40

41

42

43

44

45

46

47

48

49

50

51

52

53

54

55

56

57

58

59

60

61

62

63

64

65

66

67

68

69

70

71

72

73

74

75

76

77

78

79

80

81

82

83

84

85

86

87

88

89

90

91

92

93

94

95

96

97

98

99

100

101

102

103

104

105

106

107

108

109

110

111

112

113

114

115

116

117

118

119

120

121

122

123

124

125

126

127

128

129

130

131

132

133

134

135

136

<script>

  let echarts = require('echarts/lib/echarts');

  // 引入柱状图

  require('echarts/lib/chart/bar');

  require('echarts/lib/component/tooltip');

  require('echarts/lib/component/title');

  // import echarts from 'echarts'

    export default {

      name: "bargraph",

      // props:['id'],  // 第一种接收父亲传过来的值的方式

      props: {

        id: {

          type: String,

          default: 'chart'

        }

      },

      data(){

          return {

            msg: "我是第一个子组件--bar",

            chart: null,

          }

      },

      mounted(){

        this.drawBar();

      },

      methods:{

        drawBar(){

          this.chart = echarts.init(document.getElementById(this.id));

          let colors = ['#5793f3', '#d14a61', '#675bba'];

          this.chart.setOption(

            {

              color: colors,

              tooltip: {

                trigger: 'axis',

                axisPointer: {

                  type: 'cross'

                }

              },

              grid: {

                right: '20%'

              },

              toolbox: {

                feature: {

                  dataView: {show: true, readOnly: false},

                  restore: {show: true},

                  saveAsImage: {show: true}

                }

              },

              legend: {

                data:['蒸发量','降水量','平均温度']

              },

              xAxis: [

                {

                  type: 'category',

                  axisTick: {

                    alignWithLabel: true

                  },

                  data: ['1月','2月','3月','4月','5月','6月','7月','8月','9月','10月','11月','12月']

                }

              ],

              yAxis: [

                {

                  type: 'value',

                  name: '蒸发量',

                  min: 0,

                  max: 250,

                  position: 'right',

                  axisLine: {

                    lineStyle: {

                      color: colors[0]

                    }

                  },

                  axisLabel: {

                    formatter: '{value} ml'

                  }

                },

                {

                  type: 'value',

                  name: '降水量',

                  min: 0,

                  max: 250,

                  position: 'right',

                  offset: 80,

                  axisLine: {

                    lineStyle: {

                      color: colors[1]

                    }

                  },

                  axisLabel: {

                    formatter: '{value} ml'

                  }

                },

                {

                  type: 'value',

                  name: '温度',

                  min: 0,

                  max: 25,

                  position: 'left',

                  axisLine: {

                    lineStyle: {

                      color: colors[2]

                    }

                  },

                  axisLabel: {

                    formatter: '{value} °C'

                  }

                }

              ],

              series: [

                {

                  name:'蒸发量',

                  type:'bar',

                  data:[2.0, 4.9, 7.0, 23.2, 25.6, 76.7, 135.6, 162.2, 32.6, 20.0, 6.4, 3.3]

                },

                {

                  name:'降水量',

                  type:'bar',

                  yAxisIndex: 1,

                  data:[2.6, 5.9, 9.0, 26.4, 28.7, 70.7, 175.6, 182.2, 48.7, 18.8, 6.0, 2.3]

                },

                {

                  name:'平均温度',

                  type:'line',

                  yAxisIndex: 2,

                  data:[2.0, 2.2, 3.3, 4.5, 6.3, 10.2, 20.3, 23.4, 23.0, 16.5, 12.0, 6.2]

                }

              ]

            }

          )

        }

      }

    }

</script>

  • 创建pieGraph.vue

1

2

3

4

5

6

7

8

9

<template>

    <div>

      <p>{{ msg }}</p>

      <div class="charts">

        <div :id="id" style="min-height: 350px;"></div>

      </div>

    </div>

</template>

1

2

3

4

5

6

7

8

9

10

11

12

13

14

15

16

17

18

19

20

21

22

23

24

25

26

27

28

29

30

31

32

33

34

35

36

37

38

39

40

41

42

43

44

45

46

47

48

49

50

51

52

53

54

55

56

57

58

59

60

61

62

63

64

65

66

67

<script>

  import echarts from 'echarts'

    export default {

      name: "piegraph",

      props:{

        id: {

          type: String,

          default: 'pieChart'

        }

      },

      data(){

          return{

            msg: '我是第二个子组件--pie',

            pieChart: null

          }

      },

      mounted(){

          this.drawPie();

      },

      methods: {

        drawPie () {

          this.pieChart = echarts.init(document.getElementById(this.id));

          this.pieChart.setOption(

            {

              title : {

                text: '某站点用户访问来源',

                subtext: '纯属虚构',

                x:'center'

              },

              tooltip : {

                trigger: 'item',

                formatter: "{a} <br/>{b} : {c} ({d}%)"

              },

              legend: {

                orient: 'vertical',

                left: 'left',

                data: ['直接访问','邮件营销','联盟广告','视频广告','搜索引擎']

              },

              series : [

                {

                  name: '访问来源',

                  type: 'pie',

                  radius : '55%',

                  center: ['50%', '60%'],

                  data:[

                    {value:335, name:'直接访问'},

                    {value:310, name:'邮件营销'},

                    {value:234, name:'联盟广告'},

                    {value:135, name:'视频广告'},

                    {value:1548, name:'搜索引擎'}

                  ],

                  itemStyle: {

                    emphasis: {

                      shadowBlur: 10,

                      shadowOffsetX: 0,

                      shadowColor: 'rgba(0, 0, 0, 0.5)'

                    }

                  }

                }

              ]

            }

          )

        }

      }

    }

</script>

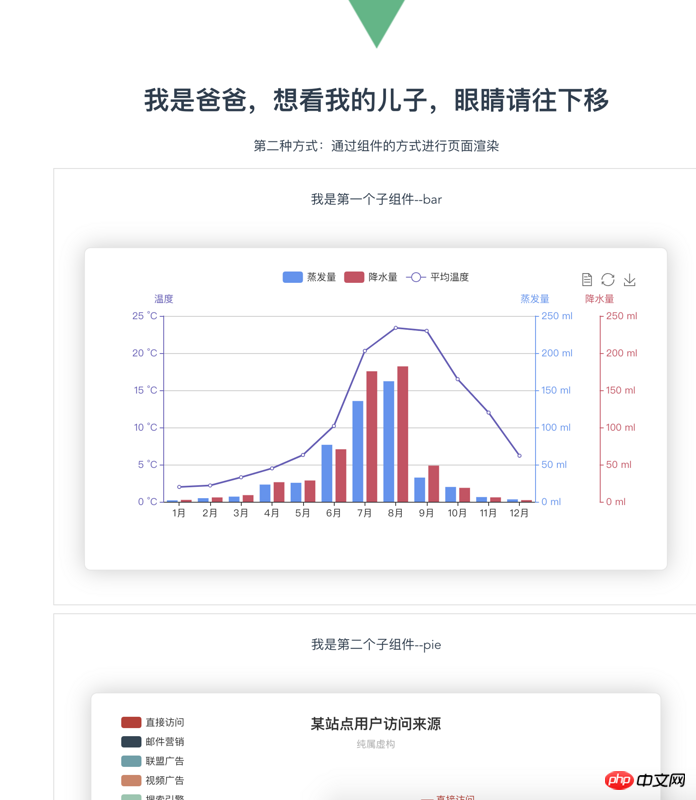
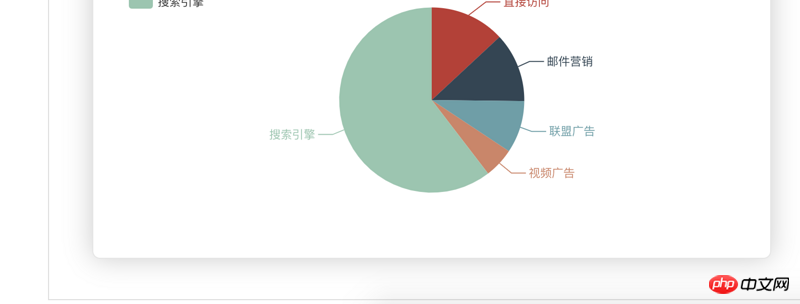
效果实现如下:
3029923647-5bc7e566552c2_articlex.png
3113537423-5bc7e5a2b6020_articlex.png

  • 路由文件如下:

1

2

3

4

5

6

7

8

9

10

11

12

13

14

15

16

17

18

19

20

21

22

23

24

25

26

27

28

29

30

31

32

import WelcomePage from '@/components/WelcomePage'

import Father from '@/components/father'

import BarGraph from '@/components/bargraph'

import PieGraph from '@/components/piegraph'

export default new Router({

  routes: [

    {

      path: '/',

      name: 'WelcomePage',

      component: WelcomePage

    },

    {

      path: '/father',

      name: 'father',

      component: Father,

      children:[

        {

          path: '/bargraph',

          name: 'bargraph',

          component: BarGraph

        },

        {

          path: '/piegraph',

          name: 'piegraph',

          component: PieGraph

        }

      ]

    },

  ]

})

以上就是vue文件如何使用echarts.js?(两种方法介绍)的详细内容,更多请关注泽林博客其它相关文章!
 

本文转载于:segmentfault思否

本作品采用 知识共享署名 4.0 国际许可协议 进行许可
标签: vue
最后更新:2018年10月19日

NiZerin

博主已经躺平了,后面很少会更新博客。

打赏 点赞
< 上一篇
下一篇 >

文章评论

razz evil exclaim smile redface biggrin eek confused idea lol mad twisted rolleyes wink cool arrow neutral cry mrgreen drooling persevering
取消回复

分类
  • Angular
  • CSS3
  • docker
  • Flutter
  • git
  • Go
  • H5
  • Java
  • JavaScript
  • Laravel
  • linux
  • Node.js
  • PHP
  • Python
  • React
  • redis
  • Vue.js
  • windows
  • WordPress
  • 交流
  • 小程序
  • 工具
  • 网站公告
标签聚合
wordpress translations vue laravel go javascript flutter php
友情链接
  • PHP函数字典
  • 宝塔运维特惠
  • 科学上网
  • 阿里云特惠

COPYRIGHT © 2021 nizer.in. ALL RIGHTS RESERVED.

Theme Kratos Made By Seaton Jiang